
Submitted May 20, 2021
Group Members
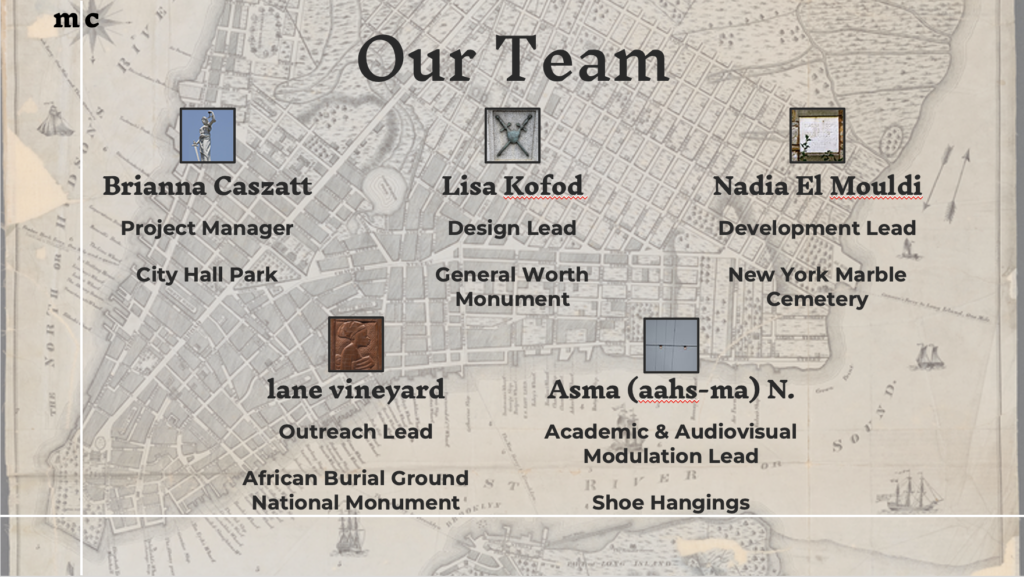
Brianna Caszatt: Project Manager
Researcher: Cemetery That Was Repurposed as a Public Park (City Hall Park)
In her primary role as project manager, Brianna created a group space for everyone’s internal communications and workflow needs, she set the meeting agendas and kept notes during each meeting, and she made sure blockers were addressed and goals were met. She manages the team’s private group page and public site on the CUNY Academic Commons. For this first phase of the project, she was also responsible for researching and maintaining the data on a cemetery that was redeveloped and turned into a public park.
Lisa Kofod: Design and User Experience Lead
Researcher: War Memorial (General Worth Monument)
Lisa’s primary roles were site design and testing. This included working with the developer on which platform to use and what frameworks to apply, creating best practices for the incorporation of digital assets, and testing the site as it was developed. Their secondary roles were in documentation and research. Documentation includes tracking conversations during the development stage and encouraging the team away from scope creep. Research responsibilities included working on technical options and scholarly research on a set of war memorials within Manhattan.
Nadia El Mouldi: Development Lead
Researcher: Historical Cemetery Space That Still Exists as Such (New York Marble Cemetery)
Nadia was responsible for the web development and mapping effort. This included framework and tool selection, as well as implementation and testing. She was also responsible for a portion of the research and data collection, pertaining to historic cemeteries in New York City.
lane vineyard: Outreach Lead
Researcher: Cemetery Space That Was Repurposed, Later Rediscovered, and Exists Again as Such (African Burial Ground National Monument)
lane’s primary role for the project was outreach, which entailed the creation and maintenance of an online presence for the project (Instagram, Facebook, and TikTok). Additionally, they did primary research for the African Burial Ground National Monument that was showcased in this phase of the project.
Asma N.: Academic and Audiovisual Modulation Lead
Researcher: Hidden Memorial Spaces (Shoe-Hangings)
Asma served as a lead in academic research and audio production for the project. She also supported project outreach and is producing the limited series audio project, Mapping Cemeteries: After Life, about the lines that brought the team and our work together.
Project Narrative
Overview
Mapping Cemeteries is a digital humanist timeline and mapping project that explores the deathscape across New York City.
We understand a deathscape to encompass both physical and notional spaces recognizing all acts of care pertaining to death and memorialization. For this project, we used both a historical and a necropolitical lens to understand the city’s deathscapes, and to ask a fundamental question: Who gets to be remembered after death? We began with Dr. Achille Mbembe’s definition of necropolitics as “the power and the capacity to dictate who may live and who must die.” With this definition in mind, we explored what roles the city has played (and continues to play) in determining how people die and who is remembered. We also used an infrastructural lens, acknowledging that infrastructure can enhance but also necessarily limits how people interact with it. In our research and development process we sought to understand how city policies and definitions of space affect our lived experiences of the city.
Cemeteries offer a rich perspective through which we can study New York City history. They provide evidence of changing traditions and practices of care, and we found more of an immediate and intimate connection to these spaces as they are so tied to people compared with other types of infrastructure and architecture. In these places, there is an inherent tension between remembering and forgetting, with both human memory and markers subject to erosion. Within a metropolis like New York City, its large population confined by a limited geographical area adds to this tension. A population of many millions necessarily requires the care of a larger number of dead, and it also means that the physical spaces allotted for the dead compete with the spaces allotted for the varied activities of the living.
Mapping is a tool through which we can examine places and their relationships to each other. Maps can also help us to find our location within the spaces around us. In this project, we used mapping as one way to put our locations in dialogue with each other, as well as to put New Yorkers in dialogue with the deathscape around them. But we acknowledge that mapping always leaves something out, so through our timeline we created a map that reveals aspects of the deathscape that have been hidden or overlooked, and we added layers to this understanding by linking text, images, and audio.
Environmental Scan
There is much interest in cemetery studies as it relates to personal genealogies and family histories. Companies like Digital Legacys sell brass squares with QR codes that can be affixed to a headstone and then direct the user to a personal legacy page, and projects like Billion Graves seek to document cemeteries throughout the world using GPS and crowdsourcing.
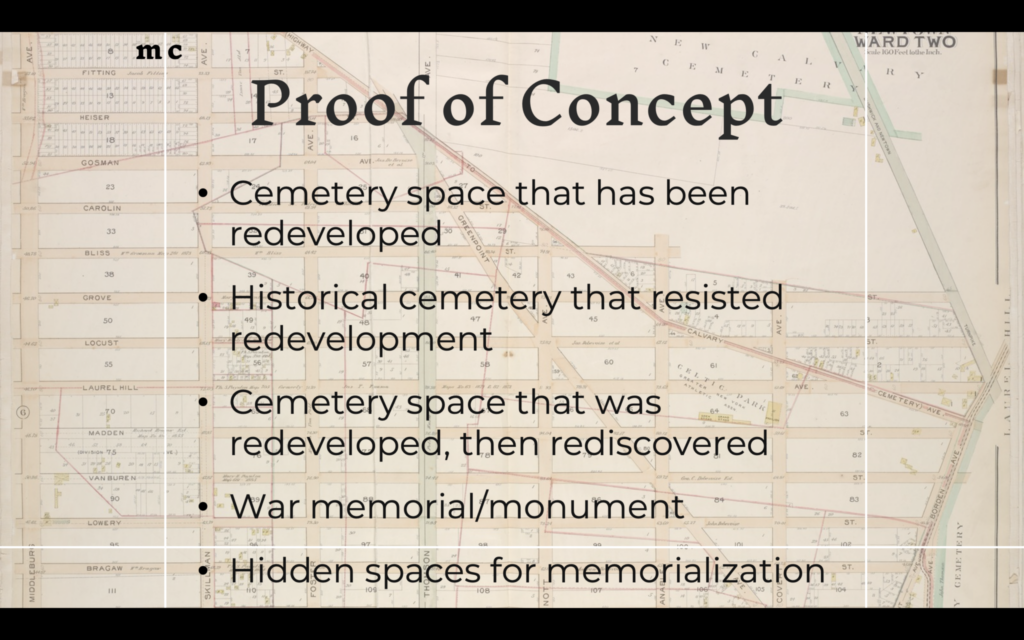
On a local level, various blogging sites like Untapped Cities, Untapped New York, and Forgotten New York have documented the history of specific New York City cemeteries. But this project seeks to view cemeteries on a different scale and aims to position them in relation to and as part of the urban landscape in New York City. As a proof of concept, we focused on five types of spaces that showcase different facets of the deathscape:
- a historical cemetery that still exists as such (New York Marble Cemetery)
- a memorial that is hidden in plain sight (Shoe-Hangings)
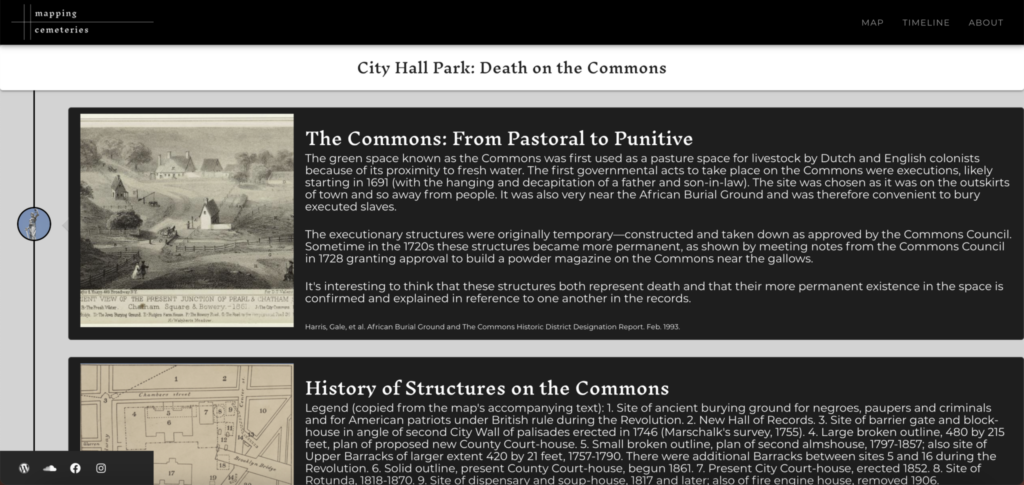
- a cemetery that was repurposed as a public park (City Hall Park)
- a cemetery that was repurposed, later rediscovered, and exists again as such (African Burial Ground National Monument)
- a war memorial (General Worth Monument)
Ours is not the first academic project to focus on the New York City deathscape. Previous Methods and Practices students and other local researchers have created New York City–centric projects that speak to the city’s deathscape:
- Necropolis was a previous Methods and Practices course project. Working with the burial records of Shearith Israel’s Second Cemetery, the team created a thick map and timeline and put the lives of the cemetery’s inhabitants into the context of New York City between 1805 and 1829 (when the cemetery was active).
- The Classical Tombs Project is directed by Dr. Shelley Hales, at the University of Bristol, and Dr. Elizabeth Macaulay-Lewis, at The Graduate Center (GC), City University of New York (CUNY). This project aims to explore cultural practices as evidenced through the architectural styles of prominent rural cemeteries in London and New York City.
- The New York City Cemetery Project, created by anthropologist and museums and archives specialist Mary French, comprises archival research and a narrative snapshot for each cemetery, accompanied by historical images, newspaper clips, and snippets of maps, for approximately 350 cemeteries in the city dating from the colonial period onward.
- In her anthropology PhD dissertation for the GC, Dr. Elizabeth Meade sets about providing the most complete record of historical cemeteries in the five boroughs. She admits that her study is incomplete as it includes only cemeteries that were intentionally built and recognized as such. It is also based on the historical records available from the colonial period onward, and so excludes the burial activities of Indigenous people pre-contact. Furthermore, as record-keeping and preservation are timely and not without significant costs, much of the available records likely skew toward cemeteries and groups of European descent with means. Her dissertation presents the maps in segments (as a limitation of the size of the page), but she also has built a website with the full map.
Necropolis and The Classical Tombs Project were created as proofs of concept, limiting their initial phases to a small number of locations, just as we have. Necropolis was created with the help of cemetery records, which we knew we would not have access to during the COVID-19 pandemic. So our project has taken a very different approach to research. Furthermore, both of these projects are examining more prominent cemeteries that still exist as such, whereas Mapping Cemeteries has included memorial spaces that are hidden–either through redevelopment of the land or because not all practices of memorialization are recognized across different communities.
While the New York City Cemetery Project is a tremendous achievement offering a wealth of knowledge on the cemeteries therein, its blog-like presentation of the information does not easily allow for an examination of the cemeteries in comparison with one another or give an understanding of the physical spaces they occupy or occupied in relation to the city as a whole. And Dr. Meade’s deathscape is currently limited to a traditional, aerial-view map that includes little else of the city. Our project seeks to create a fuller user experience by sharing the deathscape through an interactive timeline, story scrolling, and audio narrative. While we began with five examples, future iterations will add more locations, and this will expand the conversation.
Audience
Mapping Cemeteries is a digital humanities (DH) project in conversation with academic and non-academic audiences who are seeking accessible text, visual, and audio resources that explore our complex relationships with death. Our audience can be seen as a pyramid:
- ourselves
- our classmates
- the CUNY community
- the greater academic community studying deathscapes and necropolitics
- a more general, non-academic audience interested in New York City history
With these audiences in mind, Mapping Cemeteries began its initial phase with the graduate students of the Spring 2021 DHUM 70002 Digital Humanities: Methods and Practices course (taught by Dr. J. Bret Maney) GC. Our classmates are individuals who self-identify as digital humanists, archivists, researchers, artists, and technologists. Our class had publicly posted their skill sets and interests to our class blog. Asma conducted a small textual analysis project (referred to as text mining in the literary and DH fields) using the data mining tool Voyant.
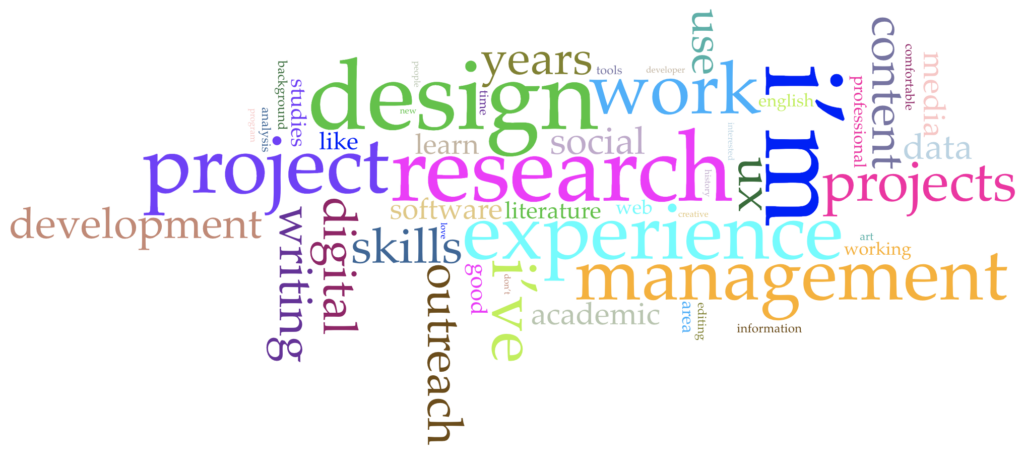
The image above is a word-cloud image from that research project. (For the full analysis, visit https://voyant-tools.org/?corpus=703e77fa6a4c85bec112d79c526ccd76&panels=cirrus,reader,trends,summary,contexts.) After analyzing the Voyant data, we decided to focus on a novel site design and robust research.
We also created a secondary site on the CUNY Academic Commons named Making Mapping Cemeteries that documented our creative process via personal and group blog posts, and we created a special audio project further exploring our research and our journey together. We see next year’s Methods and Practices students and other scholars new to the DH field as a future audience who may be served through these additional resources.
Project Activities
Initial Goals
The initial goal of the project was to create two maps layered on top of one another. The bottom layer was going to show all of the cemeteries in New York City as they existed in 1820, including data about when they were built and what affiliations they had (such as religious, commercial, or public). The top layer was going to show them in 2020. The aim was to visualize cemetery obliteration and discover patterns among the cemetery spaces that were repurposed, as a means to ask questions related to urban planning, sustainability, and community building.
Reassessing Our Work Plan: Adjustments and Changes
The original project proposal for Mapping Cemeteries relied heavily on the research of anthropologist Dr. Elizabeth Meade. As a recent PhD graduate, Dr. Meade is working to expand her dissertation research into other personal projects. Understandably, she was hesitant to share her data with our student group. This felt like a major blow at the time, but in hindsight, it was the best thing to happen to the project as it gave us space to think about what we could contribute to this area of study. And it meant we did not have to balance another person’s schedule and expectations on top of our own.
Another major change happened when we refocused our audience to include ourselves and our class as the primary audience. In the early stages of development, it was easy to get caught up in thinking that we have to deliver a certain kind of final project and it had to be in its final spectacular form and ready for “primetime.” But we took a moment and realized that part of what we are delivering on for this project is the actual process of creation—it is not just about where we ended up, but very much about how we got there. This realization gave us room to acknowledge ourselves as the very first audience of the project and encouraged us to take time to think about how we could serve ourselves while building the project. This included being respectful of workloads, allowing room for fun and exploring tangents, and being flexible to change course when we encountered roadblocks.
All of the above led us to re-envision the project as a proof-of-concept focusing on five types of memorial spaces that we identified as representing different aspects of the deathscape across the city that each of us was interested in exploring further. And it gave us room to pick a specific location within these parameters that we were excited to research.
To manage all of the data we were finding and making, we developed our own data management workbook in a shared Google Sheet. Using the Tidy Data protocol, we designed this workbook to maintain consistency across all spreadsheets so that it would serve the needs of our developer and make it relatively easy for all of us to use. However, as the GitHub website was being built, we realized that some of our needs in the data management tool were changing, and we edited, redefined, added, and removed columns as necessary. We discussed the data management workbook in nearly every team meeting to make sure we all understood any changes and were all inputting our data consistently. This process worked well for this phase of the project, but if the project grows we will likely need to explore a different data management system.
Accomplishments
Even though we carefully addressed scope creep in almost every team meeting, we still managed to deliver even more for Mapping Cemeteries than we initially thought possible. The meat of our project and research endeavors exist on the Mapping Cemeteries site, built in and hosted on GitHub Pages. Through the CUNY Academic Commons, SoundCloud, and social media, we explore and make transparent the entirety of our process in building this project.
Mapping Cemeteries on GitHub Pages
Site: http://mappingcemeteries.com/#/
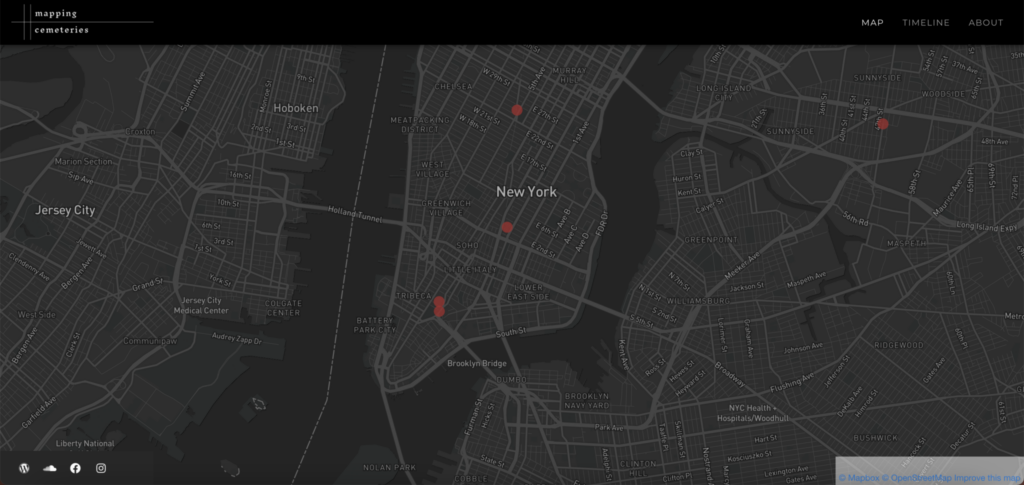
Mapping Cemeteries (mappingcemeteries.com) is a website created using Vue.js (a JavaScript framework for building single-page applications) and D3.js (a JavaScript library for data visualization). The project also utilizes Vuetify, a Vue.js material design framework. The website is hosted on GitHub Pages on the custom domain name: mappingcemeteries.com.
The user interface was designed to center both the individual deathscapes for each of the five cemeteries and their intersecting lines. This has been achieved through three main visuals:
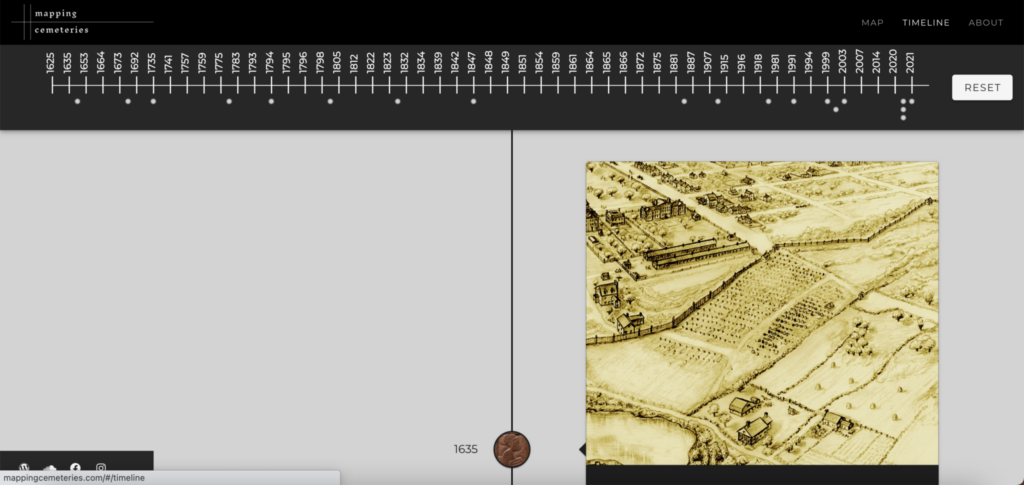
- The horizontal timeline was created using D3.js, CSS, and HTML. It includes dates of some New York City historical events that aim to position each cemetery within the city’s deathscape by adding each data point from the vertical timeline to the date it corresponds to on the horizontal one. Clicking a point on the horizontal timeline scrolls the user down to the corresponding vertical timeline data point (or card). We chose a simple monochrome “fishbone” design to allow the vertical timeline to stand out on this page.
- The vertical timeline was created using the Vuetify timeline component. Each of the cemeteries has three “cards” on this timeline, each of which contains a “Read More” button that leads to the location page for more information. We chose to highlight the data points that fit within the larger deathscape and history of New York City and that each team member wanted to highlight as part of the larger relationship between all memorials. The cards include relevant images, quotes, and information crafted by each individual team member.
- The location pages were also created using the Vuetify timeline component for design purposes; however, this was not necessarily organised in a chronological order, and it did not include date information. Each location page included more in-depth information on the specific location.
Our choice of user interactions made the above design more efficient:
- Tagging mechanism: We implemented a way of tagging each data point in the vertical timeline with a minimum of three key words. These words capture the data point as it relates to the city’s deathscape and other cemeteries’ deathscapes so multiple data points can have overlapping tags. Clicking on a tag applies a filter to the vertical timeline so it only shows the data points tagged with the clicked tag. Some examples of these words are infrastructure, disease, reinterment, and park.
- Interaction between the horizontal and the vertical timelines: the most notable part of this interaction is that it is bidirectional. Clicking on a data point on the horizontal timeline takes the user to the actual data point on the vertical timeline. Clicking the pin icon on a vertical timeline card makes the corresponding horizontal timeline data point stand out to the user through color and size change of the circle. The goal of these interactions is to create an interactive user experience that makes the navigation of our user interface components intuitive.
- Gravatars: This was a design component that appears on multiple pages of the project, as a way to remind the user of the five different locations in focus and to frame the timelines as a conversation between all team members. A click on the gravatar links the user back to the location page it corresponds to.
We also included an extensive “About” component in the website to present our team, our purpose, and our own definitions of what Mapping Cemeteries meant to us. The “About” page links back to the Making Mapping Cemeteries website, as a way to encourage users to navigate to the companion website to learn more about the process and our research.
Our team was able to deliver a final prototype that reflects our vision for Mapping Cemeteries. Each page of the website mirrors the research that team members had put into their own location but also created a conversation with other members’ locations. We enjoyed making all the decisions that went into creating the website. For example, by discussing our individual locations during our team meetings and on one of our audio episodes, we were able to organically choose which data points to include in the vertical timeline and to craft the tags that put our locations into conversation.
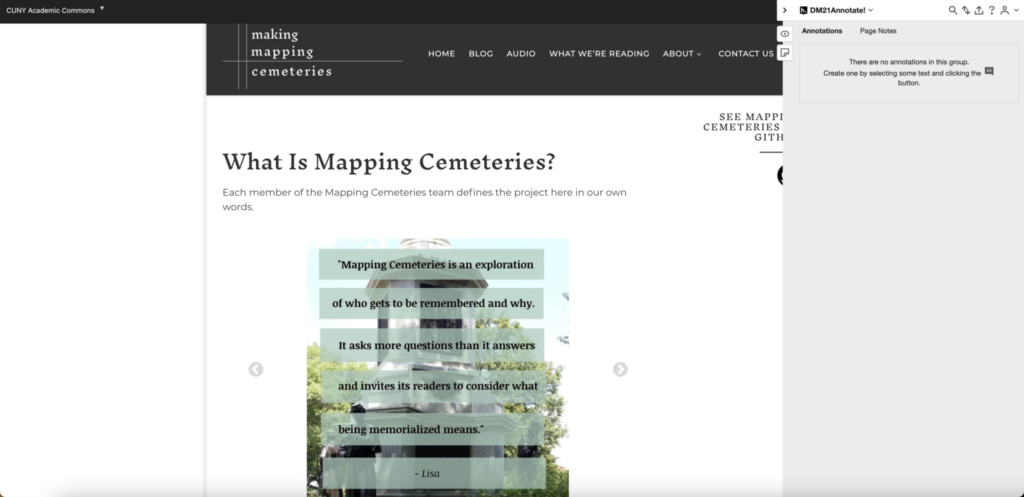
Making Mapping Cemeteries on the CUNY Academic Commons
Site: https://mappingcemeteries.commons.gc.cuny.edu/
We agreed very early on that we would create a CUNY Academic Commons group as our primary project management tool for all our communication and organizational needs. Our project has also championed transparency and pedagogy from the very beginning. The decision to then create a companion public-facing site for Mapping Cemeteries on the Commons was an easy one.
As a fun, self-reflexive exercise, we all defined the project individually and shared our answers together. It was fruitful to see how we all understand the project in the same but also in different ways, being particularly drawn to varied aspects of it. Mapping Cemeteries is not just one thing. We created a slideshow of our definitions as the landing page of the site to draw users into this conversation.
Indeed we’ve built almost every page of the site with user engagement in mind. We’ve enabled the Hypothesis collective annotation tool on almost every page of the Commons site itself, so users can comment on any page. We also have a reading list in progress, links to which we’ve shared via Hypothesis when possible in order to engage users to annotate along with us. These exercises in collective reading have influenced our work thus far and have helped us to think about death in New York City and in places beyond the scope of the project’s initial phase.
We enabled commenting on all of our blog posts. Over the course of the semester we created so much content about the project for the course blog. We’ve repurposed much of this into this site blog so that the content is more closely tied to and in conversation with the project in all of its facets—on GitHub and also on SoundCloud and social media.
We’ve also provided users with access to our full working bibliography of sources via Zotero. And in the immediate future we will provide a list of all of the tools we’ve used to build the project. We had so much fun creating the horizontal timeline on GitHub, though we had to limit ourselves to very brief data points to fit on the page. So we are also looking at ways we might expand this timeline on the Commons site. Lastly, this paper itself will be given prominence on our Commons site.
Mapping Cemeteries: After Life on SoundCloud
Site: https://soundcloud.com/mappingcemeteries
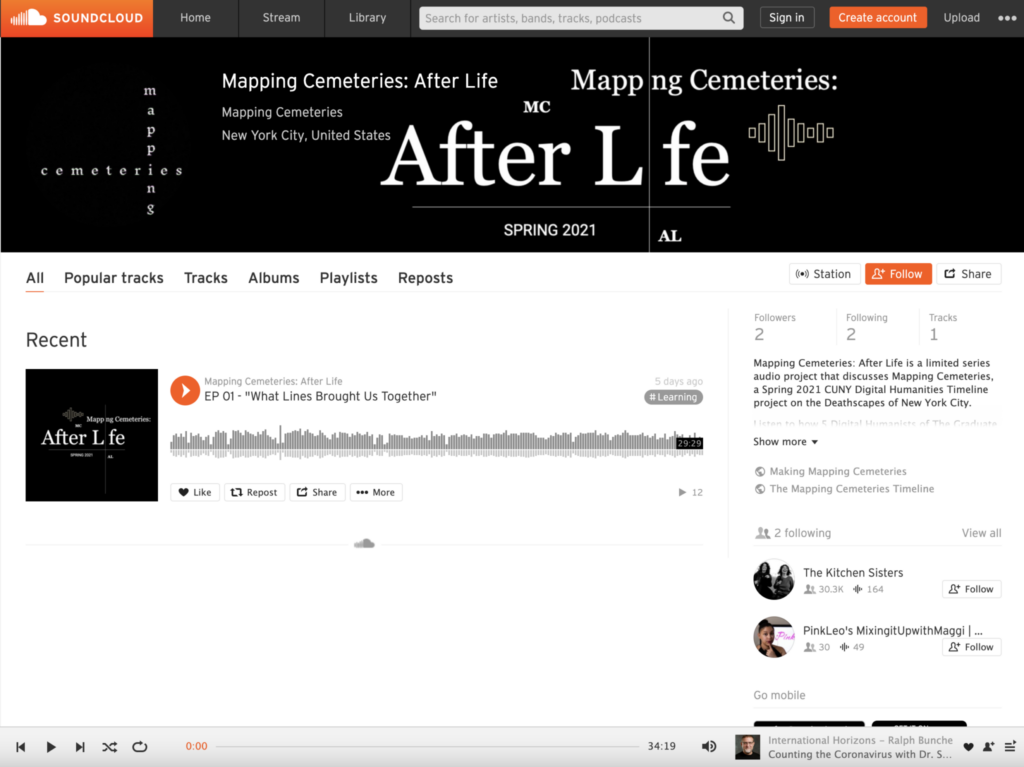
Mapping Cemeteries: After Life is a three-part, limited series audio project and record of our collaboration that can be understood as a miniature podcast. Hosted on SoundCloud, it was produced by Asma, our audiovisual modulation lead. It was imagined as a pedagogical and introspective undertaking that acquaints the audience to the team behind the Mapping Cemeteries website. After Life enlivened our collective work and outreach to our audience, increasing our project’s reproducibility.
A salient project theme is ‘scape’ (or space), and it was emphasized in the introductory episode, “What Lines Brought Us Together” through sound mixing, an area of audio editorship that manages the quality of a track. For example, a dreamy ebb-and-flow of one voice into another with slow and bassy backgrounds can be heard in this episode, which purposed the fields of our deathscapes as transitions, a metaphorical signal about passing on. GarageBand, a Digital Audio Workstation (Apple Inc.) was used to sound mix (and produce each episode). Sound mixing exposed a methodological outcome that underscored our introduction as one about a collective narrative and our project’s priority of embodied spaces.
We used field recording, another methodology of sound, to produce episode two, “Our Deathscapes,” which complements our timeline in an alternative and audible learning style. Field recording is the collection of sounds unique to a space and it is commonly used in humanistic research such as anthropology. Each team member asynchronously recorded their voiceovers and respective locations using a recording device or a voice application to sample and/or create sounds relevant to their deathscape.
“Our Deathscapes” is also a compartmentalized episode where each deathscape is isolated to a track of its own for digital embedment on respective areas of the timeline. Our audience and listeners are able to disaggregate their listenership, which harkens to the aforementioned enlivenment that we believe benefited Mapping Cemeteries as a project and our audience. After Life was a contextual and reproducible approach to documenting the lines that constitute our collaboration and deathscapes.
Mapping Cemeteries Outreach and Branding
Instagram: https://www.instagram.com/mappingcemeteries/
Facebook: https://www.facebook.com/mappingcemeteriesnyc
TikTok: https://www.tiktok.com/@mappingcemeteries?lang=en
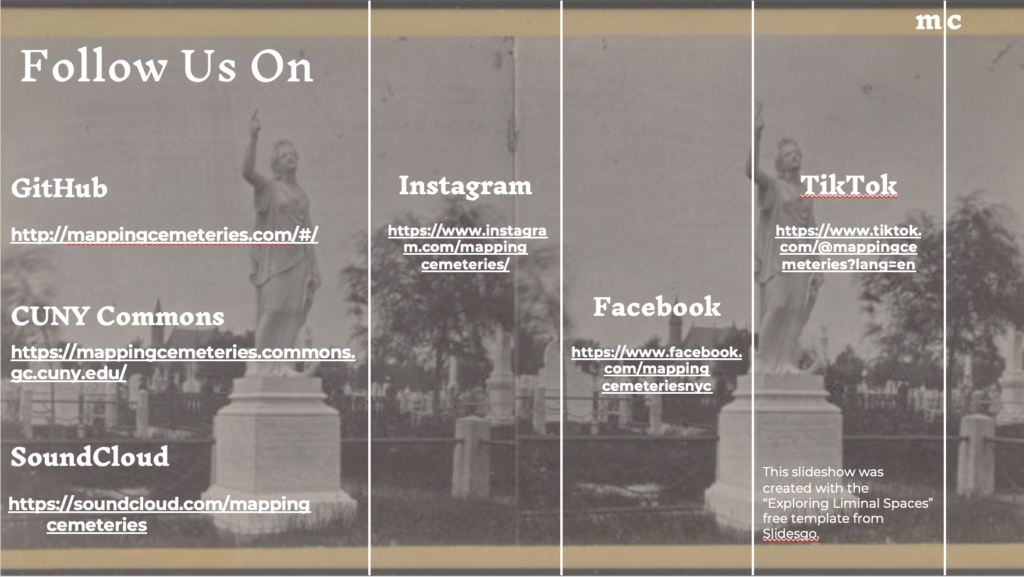
After team deliberation on which social media sites would best facilitate our initial plans for outreach, we settled on Instagram, Facebook, TikTok, and SoundCloud. To cater to our intended audience of classmates, CUNY members, academics, and fellow digital humanists, our outreach plan prioritized pedagogy and overall reproducibility of Mapping Cemeteries. Instagram and Facebook posts spotlighting the cemeteries our project focuses on and definitions of crucial topics explored in our research prioritize pedagogy, while posts informing viewers on field research methods prioritize reproducibility.
Post ideas were brainstormed during weekly virtual meetings between lane and Asma and then compiled in the outreach team’s work plan system (WPS) that was maintained on Google Sheets. Additionally, images that visually captured elements of our research topics and areas of interest were submitted by the team to help with the overall post creation process. The outreach team initially worked toward a six-week plan that included weekly to biweekly posts across each chosen social media.platform. A total of nine posts have been published on our social media accounts: seven image and text posts on Instagram and Facebook, and two videos on TikTok.
Multiple brainstorming sessions, both synchronous and asynchronous, led to the development of a fleshed out outreach plan boasting a lengthy catalogue of posts and potential ideas. It is clear now that six weeks was not enough time to touch upon all of the topics initially planned for outreach. Thus, outreach for Mapping Cemeteries will extend into the summer.
In terms of branding, evaluation of overlapping themes in research and visual elements that we felt captured them produced several logos that we have implemented across our social media accounts, Commons site, and GitHub site. While the plan was to have a single logo be representative of our project, the unique input from each team member led to multiple logos that share commonality in terms of visual elements such as font and color, but also vary to fit the overall theme or aesthetic of each platform that it is housed on.
Evaluation
Mapping Cemeteries was evaluated by many different people throughout the project build, and it is a much stronger project now because of it. We are so grateful to Dr. Maney and Micki Kaufman (MA in Digital Humanities program advisor) for joining our breakout rooms and team meetings and providing feedback throughout the course. Their mindful questions helped us address blockers, such as when our initial collaboration plans fell through.
Dr. Maney reviewed both our GitHub-hosted site and Making Mapping Cemeteries. He provided us with useful feedback from a user perspective. Part of the feedback was relating to usage and user interactions. The rest was related to the content of our research. This exercise was particularly useful because having worked on the website for a few weeks, our gaze has grown accustomed to the design. However, Dr. Maney’s comments allowed us to take a step back and realize some of the implementation issues. For example, we were able to adapt the splash page to smaller screens without losing the functionality and also to correct the wording for some of our text cards.
Brianna was in contact Lisa Hirschfield (fellow MA student in the program who led the Necropolis praxis project), and she provided much guidance and reassurance early on about what it’s like to build a DH project and was available to discuss tools her team used to build Necropolis that may be of interest to the Mapping Cemeteries team.
Asma consulted with CUNY’s Distinguished Professor of Philosophy Dr. Jesse Prinz to discuss the ethics of their deathscape in the public domain. Dr. Prinz provided guidance about contextualizing City Shoe-Hangings as a discussion that should reconsider the human experience. It informed Asma’s approach to discoursing death through text and audio for Shoe-Hangings.
Lisa had several non-academic users review the GitHub site. They provided feedback, and especially enjoyed the interactive aspect of the timeline page.
While lane did not receive any individual evaluation, tips on best practices for both research and outreach were gathered through lecture visitors like Dr. Lisa Rhody and Micki Kaufman. Feedback in the form of comments and reactions to social media posts from both fellow team members and classmates were also impactful and validating.
Presenting at the GC Digital Showcase
Preparing for the GC Digital Showcase was a stressful but ultimately very rewarding experience. It was difficult at first to figure out how to distill all of our work over the semester into five minutes. We also wanted to balance and highlight every team members’ contribution to the project, which is again hard to do within such a short span of time. Thankfully there were many opportunities to practice and receive feedback from both classmates and outside audiences, including Javier Otero Peña (MS in Data Analysis and Visualization program advisor). Brianna altered our presentation after each practice session, as our audience helped us to see which parts of the project were the most tantalizing.
The reactions we received after the Showcase were so positive. People have been excited to share with us their favorite cemetery spaces and their relationships with them, and many people have expressed to us that they are thinking about these spaces differently now after viewing our project.
Future Evaluation Form
We had originally hoped to create a Google evaluation form to solicit more information and feedback from our classmates before the GC Digital Showcase. However, we realized that timeline was not realistic for us or our classmates. Instead we are working on a form to send out to them in early June. As we are all still interested in working on this project in some capacity moving forward, we think their feedback will be of real value to us.
Based on how this assessment goes, we will consider including a similar form in the Making Mapping Cemeteries website, perhaps in the “Contact Us” page.
Future of the Project
Our team is so proud of the work we’ve done on Mapping Cemeteries, and we are all interested in continuing work on it in some capacity beyond the Spring 2021 semester. However, we also acknowledge that this semester has been a lot of work, and we are all in need of taking at least a short break so that when we return to the project we can look at it with fresh eyes and renewed excitement.
Brianna is considering how to turn Mapping Cemeteries into her capstone project. We have discussed ways we may continue as a team, including adding to our existing research and adding new locations to the project—either ourselves or by finding more collaborators. We still have so much to explore within the New York City deathscape, and of course there are deathscapes everywhere there are people, so there are lots of spaces to be explored around the globe.
Even in its current state, we see a bright future for Mapping Cemeteries. All of our code is available on GitHub for anyone who wishes to build their own version of the project. And, especially through our Making Mapping Cemeteries site and After Life audio series, we believe we created a valuable resource for future Methods and Practices students and people wanting to learn how to build a digital project.
In the short-term, we have agreed to record at least one more installment of our audio series. We also intend to create a walking tour using The Clio (a digital tool), and continue our outreach via social media.
Recording Bonus Episode of Mapping Cemeteries: After Life
The epilogical “After Life” episode will document the final reflections about our site’s timeline debut from members of the team and wider CUNY and New York City communities.
Creating a Walking Tour on The Clio Site
As part of our desire to bring a more general audience to the project, we plan to create a walking tour of our locations: starting at City Hall, then on to the African Burial Ground, the New York Marble Cemetery, and ending at the Worth Memorial with discussion of the hidden memorial as we go.
We found an existing platform, The Clio, that was originally developed as a DH project and then received funding to incorporate as a non-profit. Users can build walking tours, virtual tours of museums, hiking trails, and a few other options. It has augmented reality for navigation (users see an arrow that points them along the walk) and is built for simplicity. It is cloud- and app-based, so all of the “tech” stuff is automatic—once created user options include downloading for offline use, converting the tour to a shareable PDF, or using augmented reality. We’ve reached out to the administrator for The Clio, and they have approved our using the platform to create a tour.
Ongoing Outreach Plans
The outreach plan for Mapping Cemeteries will extend into the summer with weekly to biweekly posts on our Instagram and Facebook accounts along with the potential for additional TikTok videos. In our outreach plan’s WPS sheet, we compiled a lengthy list of ideas for social media posts, each crafted around our outreach goals of reproducibility and/or pedagogy. Another document houses a compilation of photos that visually capture elements of our project that we would like to showcase in our social media, such as images of intersecting lines, cemeteries throughout the city, and visualizations of both life and death. Posts sharing snapshots of information on our project’s cemeteries are an example of how the outreach plan will continue its efforts to promote our project and draw traffic to the site.
Works Cited
Mbembe, Achille. “Necropolitics.” Public Culture, translated by Libby Meintjes, vol. 15, no. 1, Duke University Press, 2003, pp. 11–40. Project MUSE, http://muse.jhu.edu/article/39984.
“Clio – About.” Clio, https://theclio.com/about. Accessed 18 May 2021.
“Digital Legacys.” Digital Legacys Celebrate Life with a QR Memorial, 2021, http://digitallegacys.com/.
Elmayan, Lara. “Daily What?! There’s a Quaker Cemetery in Prospect Park with 2000 Gravestones.” Untapped New York, 28 June 2013, https://untappedcities.com/2013/06/28/daily-what-quaker-cemetery-in-prospect-park/.
Fiedler, Elizabeth. “QR Codes For Headstones Keep Dearly Departed Close.” All Things Considered, NPR, 29 Sept. 2012, https://www.npr.org/2012/09/29/162011967/qr-codes-for-headstones-keep-dearly-departed-close.
Matyszczyk, Chris. “A QR Code on Your Gravestone? It’s Dead Serious.” ZDNet, 20 Oct. 2020, https://www.zdnet.com/article/a-qr-code-on-your-gravestone-its-dead-serious/.
“You Searched for Cemetery.” Forgotten New York, 18 May 2021, https://forgotten-ny.com/search/cemetery/.
Young, Michelle. “Daily What?! Burial Vaults Discovered Under NYC’s Washington Square Park.” Untapped New York, 5 Nov. 2015, https://untappedcities.com/2015/11/05/daily-what-burial-vault-discovere-dunder-nycs-washington-square-park/.
[This entry was originally posted to DHUM 70002 Digital Humanities: Methods and Practices (Spring 2021) in Final Project Reports and tagged mapping cemeteries on May 20, 2021.]

This entry is licensed under a Creative Commons Attribution-NonCommercial-ShareAlike 4.0 International license.